Please remember that this report is copyrighted and for your own personal use only! You can show it to an employer or potential employer during salary negotiations, but not give out access or leave printed copies.Company access is for use by one person in the company.
The Q4 2006 statistics in this report are based on the 91 salaried technical and marketing writers who reported in Q4 2006 (Oct. 1, 2006 to Dec. 31, 2006) and again in Q1 2007 (Jan. 1 - 15 only). The figures and percentages therefore differ somewhat from those in the Q4 2006 reports because statistics for the 42 writers who did not renew their participation in Q1 2007 were removed.
The Q2 2007 statistics are from 92 writers, 1 of whom is between jobs and 3 of who moved from contracting to in-house.
Percentages were rounded according to mathematical rounding rules, so the sum of percentages may equal 99 or 101%. Salaries for writers between jobs are not included, but the statistics on writer makeup are included in some of the breakdowns.
Adjusted Salaries
The salaries are adjusted to include the value of a company car. When no car is taken, the adjusted salary is the same as the gross salary. When an employee gives up gross salary in return for a car, that amount is added to the gross salary. When an employee receives a car in addition to salary, an estimated value of the car is added to gross salary based on the cost to the employer or other information available.
Information on bonuses was separated out, so even in special cases where a minimum annual bonus or 13th month salary is known, the monthly equivalent is NOT included in the adjusted salary.
Adjusted salaries do not include performance bonuses, value of stock options, educational fund, pension or other benefits.
Average, Median and Percentiles
Average is calculated by adding up all salaries and dividing the sum by the number of salaries reported. Average = SUM / # of entries.
Median is what is the salary for the person in the middle, with the same number of people earning the same or more as those earning that salary or less.
Percentiles are a ranking of entries with the lowest at 1 and the highest at 100.
25% salary means that 25% earn that salary or less, and 75% earn that salary or more. This is a low-end salary - most writers earn more.
50% salary means that 50% earn that salary or less, and 50% earn that salary or more. This is what the average, run-of-the-mill technical writer should expect to earn.
75% salary means that 75% earn that salary or less, and 25% earn that salary or more. This is what a writer who is the starting point for a high-end salary.
90% salary means that 90% earn that salary or less, and 10% earn that salary or more. This is a high-end salary - these figures are not included in this report, but I do have them for personal consulting.
General
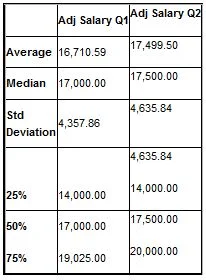
Adj Salary Q1
Adj Salary Q2
Average16,710.5917,499.50
Median17,000.0017,500.00
Std Deviation4,357.864,635.84
4,635.84
25%14,000.0014,000.00
50%17,000.0017,500.00
75%19,025.0020,000.00
Professional Organizations
30% of those reporting were paid members of at least one professional organization, slightly lower than in Q1, but up from 26% in 2006. 22% reported being members of the STC and 13% reported being members of Elephant. Memberships in all other relevant professional organizations were negligable and are therefore not included in this report.
Salaries for technical writers who were affiliated with one or more organization grew faster than salaries for writers who did not belong to any organization. This increase is consistent with the faster growth in the higher end salaries.
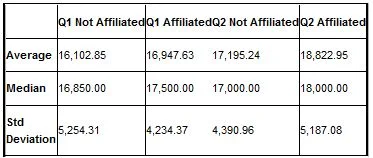
Q1 Not AffiliatedQ1 AffiliatedQ2 Not AffiliatedQ2 Affiliated
Average16,102.8516,947.6317,195.2418,822.95
Median16,850.0017,500.0017,000.0018,000.00
Std Deviation5,254.314,234.374,390.965,187.08
Writer Types
71% reported being technical writers, 5% marcom writers*, 23% documentation managers. This represents a drop in reporting by marcom writer and an increase in reporting by documentation managers. These percentages include writers between jobs, the salary figures do not. *The number of marcom writers is under reported because the job title for many of the technical writers was Technical/Marketing Writer.
The fact that most of the respondants also reported in Q4 2006 and Q1 2007, the increase in the number of documentation managers appears to reflect promotions and the growth in technical writing departments. Although the averages show increases for all types of writers, the percentile breakdowns tell a different story. The median rate for both technical and marcom writers rose by 935 and 1,500 NIS respectively, but dropped 1,250 NIS for documentation managers. The growth in the number of documentation managers may explain the drop in rates for documentation managers, with less experienced managers starting at lower salaries than the more experienced managers.
At the low end salaries dropped for both technical writers and documentation managers. This is consistent with an influx of new writers coming out of the technical writing schools.
At the high end rates were up for all writer types, indicating increasing competition for top people.
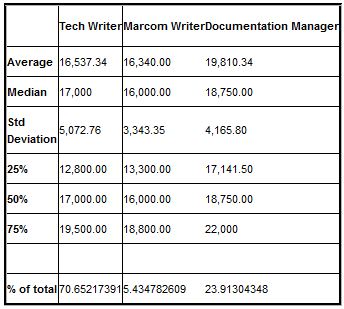
Tech Writer
Marcom Writer
Documentation Manager
Average16,537.3416,340.0019,810.34
Median17,00016,000.0018,750.00
Std Deviation5,072.763,343.354,165.80
25%12,800.0013,300.0017,141.50
50%17,000.0016,000.0018,750.00
75%19,500.0018,800.0022,000
% of total70.652173915.43478260923.91304348
Writers Between Jobs
This is a new category added this year. Only those who reported in Q4 2006 were allowed to report as between jobs. Between jobs only refers to being unemployed during the two reporting period, even if the reportee has a solid job offer in hand. A small number of employees between jobs does not necessarily indicate a slowdown, but growing numbers are important to watch for. In Q1 three writers reported being between jobs, this quarter only 1 reported being between jobs. One other writer who reported in the past left the profession for a managerial position having nothing to do with writing.
Age and Experience
These two categories are displayed together because age discrimination appears to have explained some of the anomolies in the relationship between salaries and experience. The 40-49 age group was again the best paid group. At the 25 and 50 percentile salaries increased for younger writers and dropped for those in the 50+ age group. However, in the 75 percentile where more weight is placed on experience, salaries for writers in the 50+ category rose by 625 NIS. The percentage of older writers also increased with those under 40 making up only 24% (down 3%), 40-49 making up 37% (down 2%) and 50+ making up 38% (up 4%).
Salaries continue to rise with experience and there were no surprises here. This quarter 19% reported having less than 5 years experience, an increase of 5% over last quarter; 37% had 5-10 years experience, down 9% from Q1; and 44% reported 10+ years experience, up 4%. At first glance this looks strange considering that the reporting group is very stable (very few writers joined or left the surveys). However, these changes do make sense if there is influx of new writers at the low end and at the high end companies are offering freelance writers incentives to become employees.
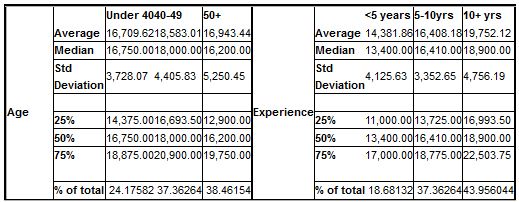
Under 4040-4950+
<5 years5-10yrs10+ yrs
AgeAverage16,709.6218,583.0116,943.44
ExperienceAverage14,381.8616,408.1819,752.12
Median16,750.0018,000.0016,200.00
Median13,400.0016,410.0018,900.00
Std Deviation3,728.074,405.835,250.45
Std Deviation4,125.633,352.654,756.19
25%14,375.0016,693.5012,900.00
25%11,000.0013,725.0016,993.50
50%16,750.0018,000.0016,200.00
50%13,400.0016,410.0018,900.00
75%18,875.0020,900.0019,750.00
75%17,000.0018,775.0022,503.75
% of total24.1758237.3626438.46154
% of total18.6813237.3626443.956044
Company Size
15% reported working for small companies of up to 50 employees (down 3%), 24% at companies with 50-100 employees (down 2%), 23% at companies with 101-300 employees (down 2%) and 37% at companies with 301+ employees (up 5%). The relationship between company size and salary continues, with salaries increasing with company size. This trend is a change from 2006, but appears to be continuing.
A comparison with last quarter shows that small companies are beginning to respond to pressures to increase salaries. In both the under 50 and 300+ categories, salaries rose by roughly 1,000 NIS across the board. Competition for writers at the high end resulted in an increase of 1,750 NIS for writers in 75 percentile at companies with 300+ employees. This is also consistent with an increased demand for documentation managers.
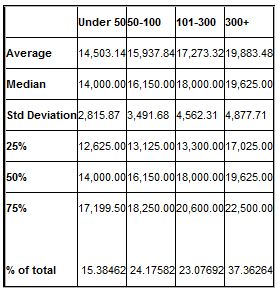
Under 5050-100101-300300+
Average14,503.1415,937.8417,273.3219,883.48
Median14,000.0016,150.0018,000.0019,625.00
Std Deviation2,815.873,491.684,562.314,877.71
25%12,625.0013,125.0013,300.0017,025.00
50%14,000.0016,150.0018,000.0019,625.00
75%17,199.5018,250.0020,600.0022,500.00
% of total15.3846224.1758223.0769237.36264
Geography
Traditionally this has been considered to have a major impact on salary. At the start of 2006 this did not appear to be true, with the exception of salaries for women in the Jerusalem area.
As the economy improved the increase in salaries appeared to lag behind in the 04 area code and even dropped in Q1 to replace 02 as the area code with the lowest salaries. A cross-check with the freelance writer statistics showed that this area code an unusually high percentage of freelance writers. This left two possible explanations, the effect of the recent war and the high percentage of freelancers (with the higher paying jobs going to freelance writers).
During the past 3 months a lot has changed in the 04 area code, with salaries rising dramatically and the percentage of salaried technical writers who work in this area increasing from 10% to 17%. There was also an accompanying drop in the percentage of freelance writer who work in the 04 area code, bringing the ratio of employees to freelancers in line with the 09 area code.
Salaries also rose dramatically in the 08 area code, but the small number of writers in this area makes the results far less reliable.
The 09 area code continues to be the best paying area, especially at the higher end. Last quarter we saw a trend of writers moving into the 03 area code, even at the expense of the 09 area code. Movement into the 03 area code appears to have stabilized, but rates continue to increase at the low-end (25 percentile). It is still too early to say whether this is a one-time phenomenon or whether opportunities are really growing faster in the Tel-Aviv area. Another interesting statistic to follow in regards to this trend is the ratio of employees to freelancers working in each area code. The number of employee writers to freelancers in the 08 and 09 area codes is nearly 3 times that of the 02, 04 and 09 area codes.
Once again salaries in the Jerusalem area (02 area code) appear to lag behind the rest of the country, with writers moving out of the area to work in neighboring areas (03 and 09).
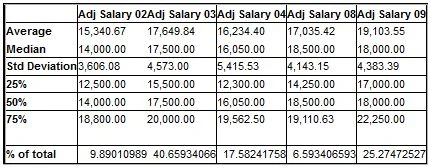
Adj Salary 02Adj Salary 03Adj Salary 04Adj Salary 08Adj Salary 09
Average15,340.6717,649.8416,234.4017,035.4219,103.55
Median14,000.0017,500.0016,050.0018,500.0018,000.00
Std Deviation3,606.084,573.005,415.534,143.154,383.39
25%12,500.0015,500.0012,300.0014,250.0017,000.00
50%14,000.0017,500.0016,050.0018,500.0018,000.00
75%18,800.0020,000.0019,562.5019,110.6322,250.00
% of total9.8901098940.6593406617.582417586.59340659325.27472527
Sex
This title is always an attention getter, but there appears to be very little sex discrimination in technical/marcom writing. It is interesting to note male salaries dropped at the low end. The number of writers is very close to even both nationwide (54% male, 47% female). The difference in the ratio of male to female writers in the 09 area has narrowed, but the 04 area code continues be an area where technical writing has become a "male profession" in those areas.
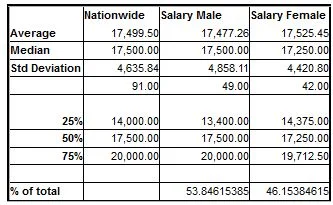
NationwideSalary MaleSalary Female
Average17,499.5017,477.2617,525.45
Median17,500.0017,500.0017,250.00
Std Deviation4,635.844,858.114,420.80
91.0049.0042.00
25%14,000.0013,400.0014,375.00
50%17,500.0017,500.0017,250.00
75%20,000.0020,000.0019,712.50
% of total
53.8461538546.15384615
Pension/Bituach Menehalim
The table below shows what percentage of gross salary the plan is based on. A comparison with Q1 shows that more and more employers are basing this benefit on 100% of gross salary.
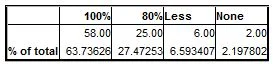
100%80%LessNone
58.0025.006.002.00
% of total63.7362627.472536.5934072.197802
Education Fund (Keren Hishtalmut)
The table below shows what percentage of gross salary the employer pays into the plan. Employees must pay 2.5% into the plan.
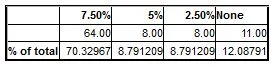
7.50%5%2.50%None
64.008.008.0011.00
% of total70.329678.7912098.79120912.08791
Salary Increases (Raises and Job Changes)
This statistic is based only on those writers who reported as employees in both Q1 and Q2. It does not include writers who joined the survey this quarter, writers who moved from freelance to employees, or writers who are between jobs. There are two sets of figures, one includes those who reported no change, some of whom may have received raises in Q4 2006; the other only includes those whose salary changed.
45% reported changes, most of which were increases. The number of increases is surprising because it goes against the traditional assumption that most companies have annual salary negotiations during Q4, with raises taking place at the end of Q4 or start of Q1.
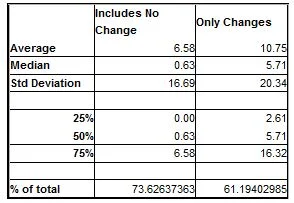
Includes No ChangeOnly Changes
Average6.5810.75
Median0.635.71
Std Deviation16.6920.34
25%0.002.61
50%0.635.71
75%6.5816.32
% of total73.6263736361.19402985
Bonuses
This is a new question that was added to the survey this quarter. In the past respondants were only asked whether or not they received annual bonuses. Bonuses were only included in the adjusted salary when they the amount was known in advance and served as part of the regular pay package (for example a 13th salary). 1/12th of the minimum amount of the bonus was added to the gross salary. This quarter, all bonuses were left out of the adjusted salary figures and respondants were asked about bonuses received during the past 3 months.
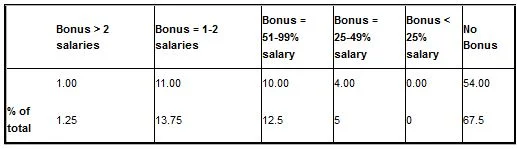
Bonus > 2 salariesBonus = 1-2 salariesBonus =
51-99% salaryBonus =
25-49% salaryBonus <
25% salaryNo Bonus
1.0011.0010.004.000.0054.00
% of total1.2513.7512.55067.5