Please remember that this report is copyrighted and for your own personal use only! You can show it to an employer or potential employer during salary negotiations, but not give out access or leave printed copies.Company access is for use by one person in the company.
The Q4 2006 statistics in this report are based on the 91 salaried technical and marketing writers who reported in Q4 2006 (Oct. 1, 2006 to Dec. 31, 2006) and again in Q1 2007 (Jan. 1 - 15 only). The figures and percentages therefore differ somewhat from those in the Q4 2006 reports because statistics for the 42 writers who did not renew their participation in Q1 2007 were removed.
The Q2 2007 statistics are from 92 writers, 1 of whom is between jobs and 3 moved from contracting to in-house.
The Q3 2007 statistics are from 83 writers, 1 of whom is between jobs and 1 moved from contracting to in-house.
Percentages were rounded according to mathematical rounding rules, so the sum of percentages may equal 99 or 101%. Salaries for writers between jobs are not included, but the statistics on writer makeup are included in some of the breakdowns.
Adjusted Salaries
The salaries are adjusted to include the value of a company car. When no car is taken, the adjusted salary is the same as the gross salary. When an employee gives up gross salary in return for a car, that amount is added to the gross salary. When an employee receives a car in addition to salary, an estimated value of the car is added to gross salary based on the cost to the employer or other information available.
Information on bonuses was separated out, so even in special cases where a minimum annual bonus or 13th month salary is known, the monthly equivalent is NOT included in the adjusted salary.
Adjusted salaries do not include performance bonuses, value of stock options, educational fund, pension or other benefits.
Average, Median and Percentiles
Average is calculated by adding up all salaries and dividing the sum by the number of salaries reported. Average = SUM / # of entries.
Median is what is the salary for the person in the middle, with the same number of people earning the same or more as those earning that salary or less.
Percentiles are a ranking of entries with the lowest at 1 and the highest at 100.
25% salary means that 25% earn that salary or less, and 75% earn that salary or more. This is a low-end salary - most writers earn more.
50% salary means that 50% earn that salary or less, and 50% earn that salary or more. This is what the average, run-of-the-mill technical writer should expect to earn.
75% salary means that 75% earn that salary or less, and 25% earn that salary or more. This is what a writer who is the starting point for a high-end salary.
90% salary means that 90% earn that salary or less, and 10% earn that salary or more. This is a high-end salary - these figures are not included in this report, but I do have them for personal consulting.
General
Overall we see very little change nationwide, with a slight drop at the high end.
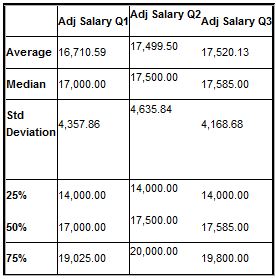
Adj Salary Q1
Adj Salary Q2Adj Salary Q3
Average16,710.5917,499.5017,520.13
Median17,000.0017,500.00
17,585.00
Std Deviation4,357.864,635.844,168.68
25%14,000.0014,000.0014,000.00
50%17,000.0017,500.0017,585.00
75%19,025.0020,000.00
19,800.00
Professional Organizations
34% of those reporting were paid members of at least one professional organization, representing a slight increase. 22% reported being members of the STC, same as last quarter; and 19% reported being members of Elephant, up 6% from last quarter. Memberships in all other relevant professional organizations were negligable and are therefore not included in this report.
Technical writers who are affiliated with a professional organization still earn more than their unaffiliated counterparts. The pattern of faster salary growth for affiliated writers seen last quarter did not really continue this quarter, with average salaries for affiliated writers actually going down relative to Q2.
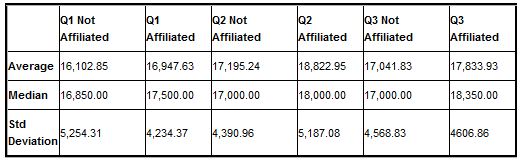
Q1 Not AffiliatedQ1 AffiliatedQ2 Not AffiliatedQ2 Affiliated
Q3 Not AffiliatedQ3 Affiliated
Average16,102.8516,947.6317,195.2418,822.9517,041.8317,833.93
Median16,850.0017,500.0017,000.0018,000.0017,000.0018,350.00
Std Deviation5,254.314,234.374,390.965,187.084,568.834606.86
Writer Types
75% reported being technical writers, 6% marcom writers*, 13% documentation managers. This represents a drop in reporting by documentation managers. These percentages include writers between jobs, the salary figures do not. *The number of marcom writers is under reported because the job title for many of the technical writers was Technical/Marketing Writer.
The differences between low-end and high-end salaries for technical writers narrowed as show by a drop in the standard deviation and an increase in low-end salaries. Marcom salaries increased at the high-end.
Salaries for documentation manager increased, reversing the trend seen last quarter. Although the salary increase is good news to documentation managers, the concurrent drop in the number of documentation managers indicates that many of the less successful managers may have lost their jobs.

Tech WriterMarcom WriterDocumentation Manager
Average16,416.0917,520.0022,165.45
Median16,987.0016,000.0022,000.00
Std Deviation4,023.475,781.614,436.57
25%14,000.0013,500.0019,200.00
50%16,987.0016,000.0022,000.00
75%19,214.5023,500.0023,710.00
% of total74.698795186.02409638613.25301205
Writers Between Jobs
This is a new category added this year. Only those who reported in Q4 2006 were allowed to report as between jobs. Between jobs only refers to being unemployed during the two reporting period, even if the reportee has a solid job offer in hand. A small number of employees between jobs does not necessarily indicate a slowdown, but growing numbers are important to watch for. In Q1 three writers reported being between jobs, while only 1 reported being between jobs this and last quarter (2 different writers).
Age and Experience
These two categories are displayed together because age discrimination appears to have explained some of the anomolies in the relationship between salaries and experience. The 40-49 age group continues to be the best paid group overall, but with an increase of 650 NIS last quarter and another 250 this quarter, the 50+ group now earns more than their younger counterparts at the high-end.
A comparison with last quarter shows that a number of hi-tech companies have begun to take notice of older technical writers who were relatively under paid. Both the average and median rates for writers 50 years old and above rose by 800-1050 NIS, while salaries for writers under 40 dropped. The drop in salaries for younger writers is consistent with an influx of new writers and the increasing weight placed on experience.
Despite the increased demand for experience and better paid offered to older writers, the percentage of writers with 10+ years experience has dropped by 3%. Less experienced writers have also seen more salary growth this quarter than their more experienced counterparts. I am not sure what this trend indicates, but it is worth watching.

Age
Under 4040-4950+
Experience
<5 years5-10yrs10+ yrs
Average15,885.4817,805.2617,777.18Average14,522.3816,238.3619,659.61
Median16,974.0018,483.0017,500.00Median14,000.0016,430.0019,075.00
Std Deviation5,277.373,657.874,772.67Std Deviation3,615.694,524.493,883.33
21.0031.0031.00
16.0033.0034.00
25%14,000.0014,950.0014,500.0025%11,216.0013,500.0017,125.00
50%16,974.0018,483.0017,500.0050%14,000.0016,430.0019,075.00
75%19,500.0019,450.0020,000.0075%17,392.5019,500.0022,000.00
% of total25.301237.349437.3494% of total19.2771139.7590440.9638554
Company Size
19% reported working for small companies of up to 50 employees (up 4%), 18% at companies with 50-100 employees (down 6%), 28% at companies with 101-300 employees (up 5%) and 34% at companies with 301+ employees (down 3%). The relationship between company size and salary continues, with salaries increasing with company size. This trend is a change from 2006, but appears to be continuing.
A comparison with last quarter shows that companies with 101-300 are beginning to respond to pressures to increase salaries at the low-end and median.

Under 5050-100101-300300+
Average15,223.7515,351.3318,216.2519,422.39
Median15,250.0016,000.0019,000.0019,393.00
Std Deviation3,242.713,950.173,828.803,987.97
25%13,085.0012,250.0016,000.0017,627.50
50%15,250.0016,000.0019,000.0019,393.00
75%17,250.0017,400.0020,400.0021,112.50
% of total19.512218.2926828.0487834.14634
Geography
Traditionally this has been considered to have a major impact on salary. At the start of 2006 this did not appear to be true, with the exception of salaries for women in the Jerusalem area. Since then salaries have increased steadily in the 02 area code to stop an outflow of writers that apparently began looking elsewhere for work.
The 04 area code has proved to be extremely volatile over time with major changes in both salaries and the ratio of salaried writers to freelancers. At first salaries appeared to lag behind those in the center of the country even dropped in Q1 to replace 02 as the area code with the lowest salaries. A cross-check with the freelance writer statistics showed that this area code an unusually high percentage of freelance writers. This left two possible explanations, the effect of the recent war and the high percentage of freelancers (with the higher paying jobs going to freelance writers). During Q2 the 04 area became more like the center of the country withwith a dramatic rise in salaries, a 7% increase in the percentage of salaried technical writers and an accompanying drop in the percentage of freelance writers who work in this area. This quarter the percentage of salaried technical writers dropped by 4% and salaries dropped by over 1,000 NIS/month.
In the 08 area code, salaries rose dramatically both this quarter and last. The small number of writers in this area make it difficult to separate trends from coincidence. However there appears to be both a movement out of the area of technical writers looking for higher salaries and a real increase in salaries for those who remain in the area.
The 09 area code continues to be the best paying area, but writers are moving out of there to the 03 area code where opportunities appear to be growing faster than elsewhere.
A careful comparison of salaries between this quarter and last show that employers in the 02 and 08 area codes are increasing salaries to compete with employers in other area codes. At the same time, employers of high-end writers in the 09 area code are becoming slightly less generous than in the past, even though it is still the highest paying area.

Adj Salary 02Adj Salary 03Adj Salary 04Adj Salary 08Adj Salary 09
Average16,330.0017,590.3015,126.7318,000.0018,688.11
Median16,500.0018,000.0015,000.0019,000.0018,500.00
Std Deviation4,306.765,101.283,621.884,242.643,886.94
25%12,875.0015,425.0012,510.0017,250.0017,000.00
50%16,500.0018,000.0015,000.0019,000.0018,500.00
75%19,412.5020,000.0018,237.0019,750.0020,875.00
% of total17.0743.9013.414.8821.95
Sex
This title is always an attention getter, but there appears to be very little sex discrimination in technical/marcom writing. The ping-pong from quarter to quarter of which sex earns more as technical writers is a clear indication that sex discrimination is not a factor in technical writing salaries. The male-female distribution of salaries in each geographic area is not equal in every area with significant differences in the 02 (+3,350 for males), 08 (+4,000 for females) and 09 areas (+1,286 for males).

NationwideSalary MaleSalary Female
Average17,520.1317,669.0716,902.86
Median17,585.0017,750.0017,000.00
Std Deviation4,150.704,509.244,623.40
25%14,250.0014,000.0014,750.00
50%17,585.0017,750.0017,000.00
75%19,800.0019,850.0019,650.00
Pension/Bituach Menehalim
The table below shows what percentage of gross salary the plan is based on. A comparison with both Q1 and Q2 shows that more and more employers are basing this benefit on 100% of gross salary.
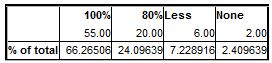
100%80%LessNone
55.0020.006.002.00
% of total66.2650624.096397.2289162.409639
Education Fund (Keren Hishtalmut)
The table below shows what percentage of gross salary the employer pays into the plan. Employees must pay 2.5% into the plan. With 85% of the respondants receiving 7.5%, the maximum benefit has become nearly universal.

7.50%5%2.50%None
71.003.001.008.00
% of total85.542173.6144581.2048199.638554
Salary Increases (Raises and Job Changes)
This statistic is based only on those writers who reported as employees in both Q2 and Q3. It does not include writers who joined the survey this quarter, writers who moved from freelance to employees, or writers who are between jobs. There are two sets of figures, one includes those who reported no change and the other only includes those whose salary changed.
The large number of changes, many of which were negative, indicates a lot of movement and job changes mixed in with raises. The survey does not currently monitor changes initiated by employees vs. those initiated by the employer. But there appears to be a lot of movement, especially when taking into consideration that the vast majority of respondants report every quarter.

Salary Increase/ Decrease
Includes No ChangeOnly Changes
Average0.200.32
Median0.001.98
Std Deviation13.9317.85
25%0.00-2.45
50%0.001.98
75%4.757.92
% of total85.3658536661.42857143
Bonuses
This question was added to the survey last quarter. Prior to that respondants were only asked whether or not they received annual bonuses. Bonuses were only included in the adjusted salary when they the amount was known in advance and served as part of the regular pay package (for example a 13th salary). 1/12th of the minimum amount of the bonus was added to the gross salary. During Q2 and Q3, all bonuses were left out of the adjusted salary figures and respondants were asked about bonuses received during the past 3 months.
This quarter there were fewer bonuses and those given were a smaller percentage of salary. This fits well with expectations that annual bonuses are given during Q1 (reported in Q2) and Q4 (reported in Q1 of the following year).

Bonus > 2 salariesBonus = 1-2 salariesBonus =
51-99% salaryBonus =
25-49% salaryBonus <
25% salaryNo Bonus
1.005.005.008.001.0062.00
% of total1.21951226.0975616.0975609769.7560975611.219512275.61
Bonus > 2 salariesBonus = 1-2 salariesBonus =
51-99% salaryBonus =
25-49% salaryBonus <
25% salaryNo Bonus
1.005.005.008.001.0061.00
% of total1.23456796.17283956.1728395069.876543211.234567975.31