This report is based on input from 33 freelance technical writers. Although this is far fewer than for salaried employees it is by far the most detailed survey yet. All rates are those actually charged, not asking rates.
How Rates Were Calculated
The way rates are calculated affects the outcome. Rates below are calculated in units of rate per writer with no weight given to the number of hours each writer works. In other words Avg = (RateForA + RateForB) / NumberOfWriters.
For example, if writer A works 200 hours/mo and charges $10/hour, while writer B works 100 hours/mo and charges $20/hr the average is calculated as follows:
Avg = ($10 + $20) / 2 = $15 .
An additional set of average salaries was calculated (with no breakdowns) based on the total amount billed divided by the total number of hours. This rate was calculated for the Direct and Subcontracting Rates only.
Direct Rate vs. Market Rate
Direct Rate = the rate charged by contractors who work directly with the client and does not include data from subcontractors.
Market Rate = the rate charged the client. This includes data from subcontractors who know what rate the client was charged.
Sub Rate = the rate received by the sub contractor.
Note: The rate used in the Affiliation breakdown is based on the rate received for direct and subcontract work according to the percentage of direct work reported.
Rate = (DirectRate * %Direct) = (SubRate * (1-%Direct))
Exchange Rates
Rates that were listed in NIS were converted to $USD at the Oct. 15 exchange rate of 4.036. This is the reason that some of the percentile rate are uneven amounts (that percentile happened to be an NIS rate converted to $USD).
The $ rate dropped dramatically at the start of April and began to rise again in July. In August the $ rate then fell again and has continued to fall. This drop combined with increasing demand appears to have made it easier for many contractors to raise their $ rates. Although the drop in the $ rate led 26% of technical writers to set at least some of their rates in NIS last quarter, only 8% reported rates in NIS this quarter. Note: the questions ask for the rate in $ unless the respondant specifies otherwise.
Average, Median and Percentiles
Average is calculated by adding up all rates and dividing the sum by the number of rates reported. Average = SUM / # of entries. An additional average based on the total amount charged by all writers/total hours billed by all writers was added to the nationwide calculations.
Median is what is the rate for the person in the middle, with the same number of people earning the same or more as those earning that rate or less.
Percentiles are a ranking of entries with the lowest at 1 and the highest at 100.
25% rate means that 25% earn that rate or less, and 75% earn that rate or more. This is a low-end rate - most writers earn more.
50% rate means that 50% earn that rate or less, and 50% earn that rate or more. This is what the average, run-of-the-mill technical writer should expect to earn.
75% rate means that 75% earn that rate or less, and 25% earn that rate or more. This is what a writer who is the starting point for a high-end rate.
90% rate means that 90% earn that rate or less, and 10% earn that rate or more. This is a high-end rate - these figures are not included in this report, but I do have them for personal consulting.
General
Technical writing rates appear to have stabilized at a new benchmark rate of just under $40/hr after a slow, but steady rise. Rates for direct contractors have dropped somewhat, while market rates which include the rates charged by companies rose slightly at the median and low end. This indicates that technical writing companies have begun to charge a little more than independent contractors. Rates for subcontractors rose dramatically well above the Q1 and Q2 rates. This suggest a number of parallel trends:
1. Clients are beginning to insist that technical writing companies use more expensive subcontractors.
2. Subcontractors are forcing a change in the percentage of the amount charged that they receive.
3. The ratio of experienced subcontractors with long-term on-site placements vis-a-vis off-site subcontractors who work on projects is changing.
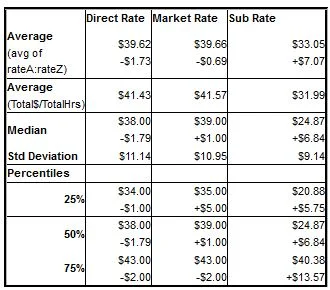
Direct RateMarket RateSub Rate
Average
(avg of rateA:rateZ)
$39.62
-$1.73
$39.66
-$0.69
$33.05
+$7.07
Average
(Total$/TotalHrs)$41.43
$41.57
$31.99
Median$38.00
-$1.79
$39.00
+$1.00
$24.87
+$6.84
Std Deviation$11.14$10.95$9.14
Percentiles
25%$34.00
-$1.00$35.00
+$5.00
$20.88
+$5.75
50%$38.00
-$1.79$39.00
+$1.00$24.87
+$6.84
75%$43.00
-$2.00
$43.00
-$2.00$40.38
+$13.57
Professional Organizations
The percentage of the freelance writers reporting that they belong to at least one professional organization has increased to the point where it exceeds the percentage that do not belong to any professional organization. This indicates that freelance writers are finding more value in professional organizations than in the past. Because of the increase in the number of affiliated writers we cannot necessarily assume a direct relationship between affiliation and an increase in rates even though rates rose for affiliated writers in all percentiles and dropped for unaffiliated writers.
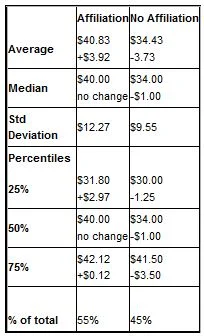
AffiliationNo Affiliation
Average$40.83
+$3.92
$34.43
-3.73
Median$40.00
no change
$34.00
-$1.00
Std Deviation$12.27$9.55
Percentiles
25%$31.80
+$2.97
$30.00
-1.25
50%$40.00
no change$34.00
-$1.00
75%$42.12
+$0.12
$41.50
-$3.50
% of total55%45%
Experience
Part of last quarters gains by the least experienced and most experienced direct contractors were lost, while rates for those in the 5-10 year category stayed relatively stable.
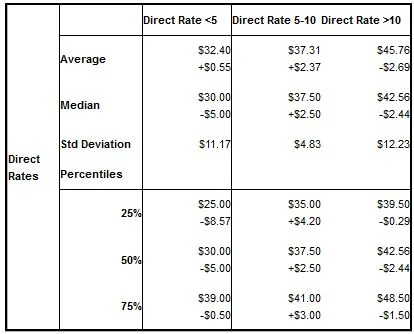
Direct Rates
Direct Rate <5Direct Rate 5-10Direct Rate >10
Average$32.40
+$0.55
$37.31
+$2.37
$45.76
-$2.69
Median$30.00
-$5.00
$37.50
+$2.50
$42.56
-$2.44
Std Deviation$11.17$4.83$12.23
Percentiles
25%$25.00
-$8.57
$35.00
+$4.20
$39.50
-$0.29
50%$30.00
-$5.00$37.50
+$2.50$42.56
-$2.44
75%$39.00
-$0.50
$41.00
+$3.00
$48.50
-$1.50
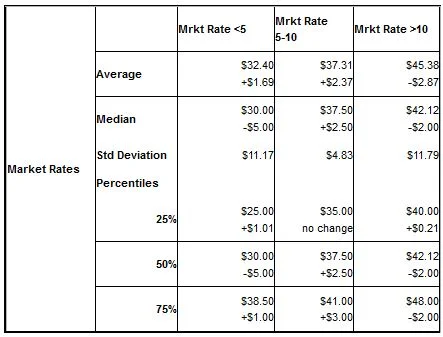
Market Rates
Mrkt Rate <5Mrkt Rate 5-10Mrkt Rate >10
Average$32.40
+$1.69
$37.31
+$2.37$45.38
-$2.87
Median$30.00
-$5.00
$37.50
+$2.50$42.12
-$2.00
Std Deviation$11.17$4.83$11.79
Percentiles
25%$25.00
+$1.01
$35.00
no change
$40.00
+$0.21
50%$30.00
-$5.00$37.50
+$2.50$42.12
-$2.00
75%$38.50
+$1.00
$41.00
+$3.00$48.00
-$2.00
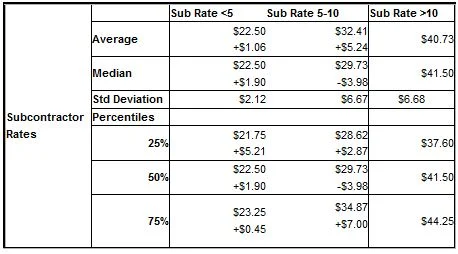
Subcontractor Rates
Sub Rate <5Sub Rate 5-10Sub Rate >10
Average$22.50
+$1.06
$32.41
+$5.24
$40.73
Median$22.50
+$1.90$29.73
-$3.98
$41.50
Std Deviation$2.12$6.67$6.68
Percentiles
25%$21.75
+$5.21
$28.62
+$2.87
$37.60
50%$22.50
+$1.90$29.73
-$3.98$41.50
75%$23.25
+$0.45
$34.87
+$7.00
$44.25
Geography
Rates for technical writers in the 04 area code continue to remain high (except at the low end). A closer analysis of the exceptionally high subcontracting rates in the 04 area shows that many of these are very experienced long-term subcontractors who could easily find work elsewhere as direct contractors.
The number of freelance technical writers who report that most of their work is in the 02 and 08 areas are too small to include in this report.
A new statistic that I "stumbled across" while comparing rates based on home vs. work area codes is for freelancers who "export" their work , i.e. work remotely for overseas clients. The number of writers is still small, but it is an interesting trend to watch. Rates for these writers are higher than for work performed in Israel. Th
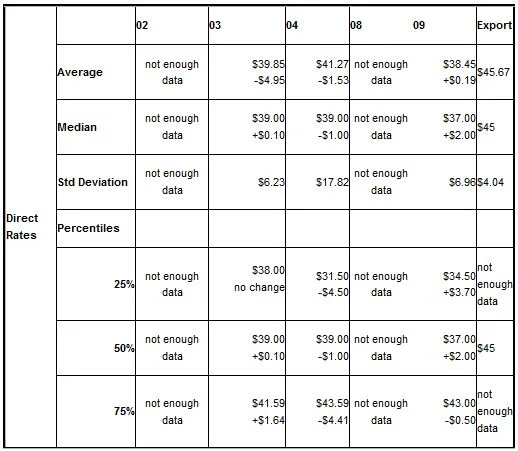
Direct Rates
02
03040809Export
Averagenot enough data$39.85
-$4.95
$41.27
-$1.53
not enough data$38.45
+$0.19
$45.67
Mediannot enough data$39.00
+$0.10
$39.00
-$1.00
not enough data$37.00
+$2.00
$45
Std Deviationnot enough data$6.23$17.82not enough data$6.96$4.04
Percentiles
25%not enough data
$38.00
no change
$31.50
-$4.50
not enough data$34.50
+$3.70not enough data
50%not enough data$39.00
+$0.10$39.00
-$1.00not enough data$37.00
+$2.00$45
75%not enough data$41.59
+$1.64
$43.59
-$4.41not enough data$43.00
-$0.50
not enough data
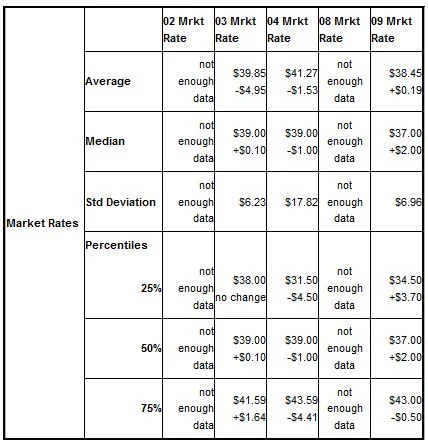
Market Rates
02 Mrkt Rate03 Mrkt Rate04 Mrkt Rate08 Mrkt Rate09 Mrkt Rate
Averagenot enough data$39.85
-$4.95$41.27
-$1.53not enough data$38.45
+$0.19
Mediannot enough data$39.00
+$0.10$39.00
-$1.00not enough data$37.00
+$2.00
Std Deviationnot enough data$6.23$17.82not enough data$6.96
Percentiles
25%not enough data$38.00
no change$31.50
-$4.50not enough data$34.50
+$3.70
50%not enough data$39.00
+$0.10$39.00
-$1.00not enough data$37.00
+$2.00
75%not enough data$41.59
+$1.64$43.59
-$4.41not enough data$43.00
-$0.50
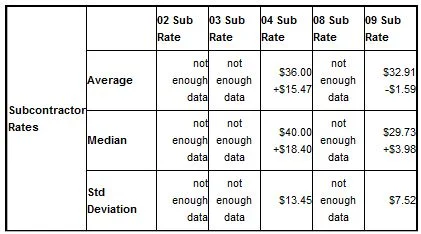
Subcontractor Rates
02 Sub Rate03 Sub Rate04 Sub Rate08 Sub Rate09 Sub Rate
Averagenot enough datanot enough data$36.00
+$15.47not enough data$32.91
-$1.59
Mediannot enough datanot enough data$40.00
+$18.40
not enough data$29.73
+$3.98
Std Deviationnot enough datanot enough data$13.45not enough data$7.52
Sex
The differences between male and female rates continues to be minor and which earns slighly more changes from quarter to quarter. This indicates that there is little if any sex discrimination in this profession.
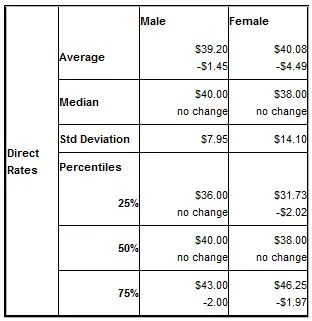
Direct Rates
Male Female
Average$39.20
-$1.45
$40.08
-$4.49
Median$40.00
no change
$38.00
no change
Std Deviation$7.95$14.10
Percentiles
25%$36.00
no change
$31.73
-$2.02
50%$40.00
no change$38.00
no change
75%$43.00
-2.00
$46.25
-$1.97
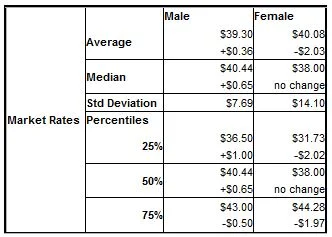
Market Rates
Male Female
Average$39.30
+$0.36$40.08
-$2.03
Median$40.44
+$0.65
$38.00
no change
Std Deviation$7.69$14.10
Percentiles
25%$36.50
+$1.00
$31.73
-$2.02
50%$40.44
+$0.65$38.00
no change
75%$43.00
-$0.50
$44.28
-$1.97
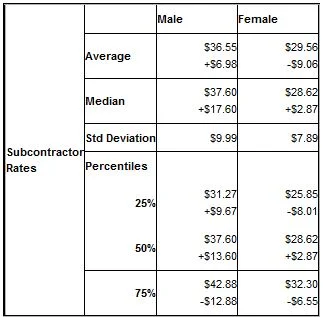
Subcontractor Rates
MaleFemale
Average$36.55
+$6.98$29.56
-$9.06
Median$37.60
+$17.60
$28.62
+$2.87
Std Deviation$9.99$7.89
Percentiles
25%$31.27
+$9.67$25.85
-$8.01
50%$37.60
+$13.60$28.62
+$2.87
75%$42.88
-$12.88$32.30
-$6.55