Please remember that this report is copyrighted and for your own personal use only! You can show it to an employer or potential employer during salary negotiations, but not give out access or leave printed copies.Company access is for use by one person in the company.
The Q4 2006 statistics in this report are based on the 91 salaried technical and marketing writers who reported in Q4 2006 (Oct. 1, 2006 to Dec. 31, 2006) and again in Q1 2007 (Jan. 1 - 15 only). The figures and percentages therefore differ somewhat from those in the Q4 2006 reports because statistics for the 42 writers who did not renew their participation in Q1 2007 were removed.
The Q2 2007 statistics are from 92 writers, 1 of whom is between jobs and 3 moved from contracting to in-house.
The Q3 2007 statistics are from 83 writers, 1 of whom is between jobs and 1 moved from contracting to in-house.
The Q4 2007 statistics are from 84 writers, 1 of whom is between jobs. Data from 3 additional writers were not included: 1 writer has left the profession, 1 was killed in a tragic car accident, and one reported but had the data deleted due to suspect information in the extended profile and no way to confirm the identity of the writer.
Percentages were rounded according to mathematical rounding rules, so the sum of percentages may equal 99 or 101%. Salaries for writers between jobs are not included, but the statistics on writer makeup are included in some of the breakdowns.
Adjusted Salaries
The salaries are adjusted to include the value of a company car. When no car is taken, the adjusted salary is the same as the gross salary. When an employee gives up gross salary in return for a car, that amount is added to the gross salary. When an employee receives a car in addition to salary, an estimated value of the car is added to gross salary based on the cost to the employer or other information available.
Information on bonuses was separated out, so even in special cases where a minimum annual bonus or 13th month salary is known, the monthly equivalent is NOT included in the adjusted salary.
Adjusted salaries do not include performance bonuses, value of stock options, educational fund, pension or other benefits.
Average, Median and Percentiles
Average is calculated by adding up all salaries and dividing the sum by the number of salaries reported. Average = SUM / # of entries.
Median is what is the salary for the person in the middle, with the same number of people earning the same or more as those earning that salary or less.
Percentiles are a ranking of entries with the lowest at 1 and the highest at 100.
25% salary means that 25% earn that salary or less, and 75% earn that salary or more. This is a low-end salary - most writers earn more.
50% salary means that 50% earn that salary or less, and 50% earn that salary or more. This is what the average, run-of-the-mill technical writer should expect to earn.
75% salary means that 75% earn that salary or less, and 25% earn that salary or more. This is what a writer who is the starting point for a high-end salary.
90% salary means that 90% earn that salary or less, and 10% earn that salary or more. This is a high-end salary - these figures are not included in this report, but I do have them for personal consulting.
General
Overall we see an increase at all major percentiles, but a slight drop in the average. The drop probably indicates an increase in the number of new writers at the low end or an increase in the number of low-end writers participating in the survey. Over the course of a year we see an increase in salary by nearly 1,000 NIS across the board.
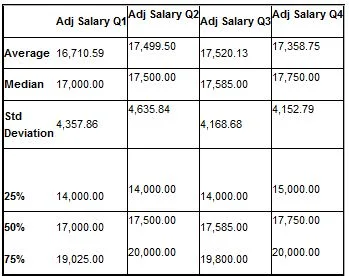
Adj Salary Q1
Adj Salary Q2Adj Salary Q3Adj Salary Q4
Average16,710.5917,499.5017,520.1317,358.75
Median17,000.0017,500.00
17,585.0017,750.00
Std Deviation4,357.864,635.844,168.684,152.79
25%14,000.0014,000.0014,000.0015,000.00
50%17,000.0017,500.0017,585.0017,750.00
75%19,025.0020,000.00
19,800.0020,000.00
Professional Organizations
33% of those reporting were paid members of at least one professional organization, representing a slight decrease. 25% reported being members of the STC, a 3% increase over last quarter; and 15% reported being members of Elephant, down 4% from last quarter. Memberships in all other relevant professional organizations were negligable and are therefore not included in this report.
Technical writers who are affiliated with a professional organization earned less this quarter than their unaffiliated counterparts. This is a change in the pattern that we have seen in the past. The reason for this change is not clear.
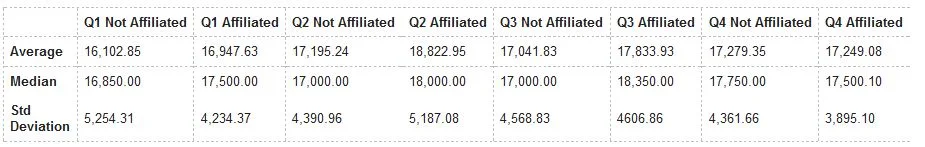
Q1 Not AffiliatedQ1 AffiliatedQ2 Not AffiliatedQ2 Affiliated
Q3 Not AffiliatedQ3 Affiliated
Q4 Not Affiliated
Q4 Affiliated
Average16,102.8516,947.6317,195.2418,822.9517,041.8317,833.93
17,279.3517,249.08
Median16,850.0017,500.0017,000.0018,000.0017,000.0018,350.00
17,750.0017,500.10
Std Deviation5,254.314,234.374,390.965,187.084,568.834606.86
4,361.663,895.10
Writer Types
A new category was added to the survey (50%Technical Writer/50% Marcom Writer) to more accurately reflect the breakdown of salaries. The data for these writers were included in the calculations at half their value for each category and counted as half positions in the calculations. For example, if 10 writers reported salaries as technical writers and 10 as 50%Technical Writer/50% Marcom Writer the calculation for the average was (10*TW salary + (10*TMW salary/2))/(10 + (10/2)). Median and percentile breakdowns followed the same principle. A single writer who reported as a technical writer in the past reported to work as a copy editor in this report. The data for that writer was not included in any of the categories in this breakdown.
71% reported being technical writers, 11% marcom writers, 17% documentation managers. This represents an increase in the number of marcom writers and documentation managers relative to technical writers. These percentages include writers between jobs, the salary figures do not.
The differences between low-end and high-end salaries for all three groups narrowed as shown by a drop in the standard deviation and an increase in low-end salaries.
Salaries for documentation manager decreased. This combined with an increase in the number of documentation managers indicates that a number of technical writers have moved into this category, thus increasing their individual salaries but earning slightly less than their counterparts.
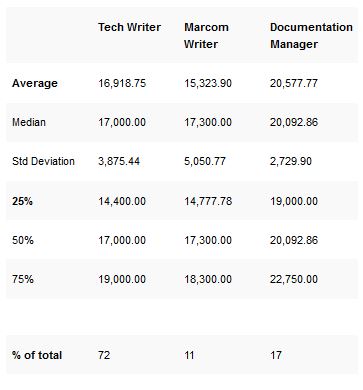
Tech WriterMarcom WriterDocumentation Manager
Average16,918.7515,323.9020,577.77
Median17,000.0017,300.0020,092.86
Std Deviation3,875.445,050.772,729.90
25%14,400.0014,777.7819,000.00
50%17,000.0017,300.0020,092.86
75%19,000.0018,300.0022,750.00
% of total721117
Writers Between Jobs
This is a new category added this year. Only those who reported in the past are allowed to report as between jobs. Between jobs only refers to being unemployed during the two reporting period, even if the reportee has a solid job offer in hand. A small number of employees between jobs does not necessarily indicate a slowdown, but growing numbers are important to watch for. In Q1 three writers reported being between jobs, while only 1 reported being between jobs over the past 3 quarters (3 different writers).
Age and Experience
These two categories are displayed together because age discrimination appears to have explained some of the anomolies in the relationship between salaries and experience. The 40-49 age group continues to be the best paid group overall and has again surpassed their older counterparts at the high-end as well. Despite the fact that the salary gap increased slightly between the 40-49 age group and the 50+ group, the 900 NIS increase over the previous 2 quarters shows that a number of hi-tech companies have begun to take notice of older technical writers who were relatively under paid.
Differences in salaries based on experience is growing with the exception of the writers with 10+ years experience at the high end. The reason for this drop is unclear, but may be related to mobility between in-house salaried employees and freelance writers at the high end.
A look at the percentages of writers reporting in each category indicates an increase in age overall. This may be a trend or simply due to writers being at the edge of the age groupings.
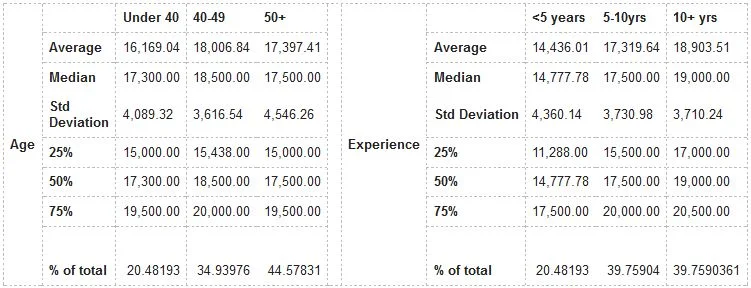
Age
Under 4040-4950+
Experience
<5 years5-10yrs10+ yrs
Average16,169.0418,006.8417,397.41Average14,436.0117,319.6418,903.51
Median17,300.0018,500.0017,500.00Median14,777.7817,500.0019,000.00
Std Deviation4,089.323,616.544,546.26Std Deviation4,360.143,730.983,710.24
25%15,000.0015,438.0015,000.0025%11,288.0015,500.0017,000.00
50%17,300.0018,500.0017,500.0050%14,777.7817,500.0019,000.00
75%19,500.0020,000.0019,500.0075%17,500.0020,000.0020,500.00
% of total20.4819334.9397644.57831% of total20.4819339.7590439.7590361
Company Size
This breakdown has been one of the most interesting and volatile breakdowns over the past year.
18% reported working for small companies of up to 50 employees (down 1%), 20% at companies with 50-100 employees (up 2% from last quarter and down 4% from Q2), 28% at companies with 101-300 employees (no change but up 5% from Q2) and 34% at companies with 301+ employees (no change).
Although the relationship between company size and salary continues for companies of 50+ employees, small companies with under 50 employees have started to seriously compete for writers and are now paying more than companies with 50-100 employees, but it appears that they are "stealing away" employees from the larger companies (101+ employees) while the larger companies appear to be hiring more writers at the lower end.
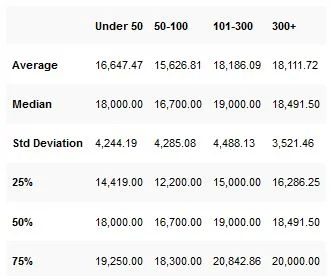
Under 5050-100101-300300+
Average16,647.4715,626.8118,186.0918,111.72
Median18,000.0016,700.0019,000.0018,491.50
Std Deviation4,244.194,285.084,488.133,521.46
25%14,419.0012,200.0015,000.0016,286.25
50%18,000.0016,700.0019,000.0018,491.50
75%19,250.0018,300.0020,842.8620,000.00
Geography
Traditionally this has been considered to have a major impact on salary. At the start of 2006 this did not appear to be true, with the exception of salaries for women in the Jerusalem area. Since then salaries have increased steadily in the 02 area code to stop an outflow of writers that apparently began looking elsewhere for work. Despite the rise in salary, only 17% of Israel's technical/marcom writers work in this area code even though 28% report living there.
The trend of writers moving into the 03 area code has slowed, but not stopped with nearly 44% of salaried writers reporting that they work in this area code even though only 17% live in the 03 area code.
The 04 area code has proved to be extremely volatile over time with major changes in both salaries and the ratio of salaried writers to freelancers. This quarter salaries in this area showed a significant increase at the high-end and slight increase at the low-end, but both the median and average salaries dropped.
The small number of writers working in the 08 area code makes it difficult to separate trends from coincidence.
The 09 area code continues to be the best paying area, but the gap is narrowing as salaries in other areas slowly catch up.
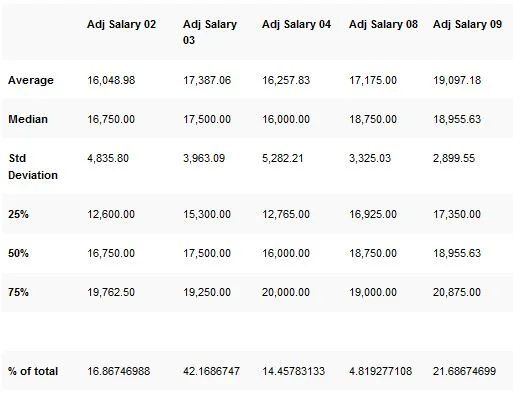
Adj Salary 02Adj Salary 03Adj Salary 04Adj Salary 08Adj Salary 09
Average16,048.9817,387.0616,257.8317,175.0019,097.18
Median16,750.0017,500.0016,000.0018,750.0018,955.63
Std Deviation4,835.803,963.095,282.213,325.032,899.55
25%12,600.0015,300.0012,765.0016,925.0017,350.00
50%16,750.0017,500.0016,000.0018,750.0018,955.63
75%19,762.5019,250.0020,000.0019,000.0020,875.00
% of total16.8674698842.168674714.457831334.81927710821.68674699
Sex
This quarter women are earning more than their male counterparts across the board. This makes for an interesting headline, but the ping-pong from quarter to quarter of which sex earns more indicates that sex discrimination is not really a factor in technical writing salaries. The male-female distribution of salaries in each geographic area is not equal in every area with significant differences in the 02 (+2,750 for males), 03 (+2,085 for females), 08 (+3,150 for females) and 09 areas (+1,295 for females).
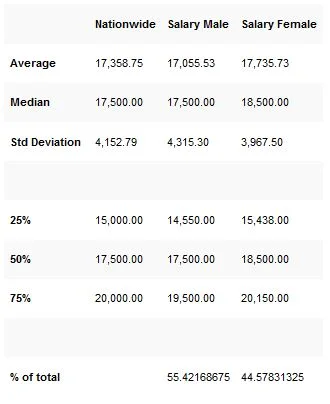
NationwideSalary MaleSalary Female
Average17,358.7517,055.5317,735.73
Median17,500.0017,500.0018,500.00
Std Deviation4,152.794,315.303,967.50
25%15,000.0014,550.0015,438.00
50%17,500.0017,500.0018,500.00
75%20,000.0019,500.0020,150.00
% of total
55.4216867544.57831325
Pension/Bituach Menehalim
The table below shows what percentage of gross salary the plan is based on. A comparison with last quarter shows an increase in the number of employers who are basing this benefit on 80% of gross salary. This may be due to the way employees who receive company cars report this benefit because the benefit usually does not extend to the value of the car. However this is an important statistic to follow.
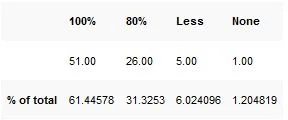
100%80%LessNone
51.0026.005.001.00
% of total61.4457831.32536.0240961.204819
Education Fund (Keren Hishtalmut)
The table below shows what percentage of gross salary the employer pays into the plan. Employees must pay 2.5% into the plan. Surprisingly the percentage of employees receiving 7.5% (maximum benefit) has dropped to 63%. This is a very bad sign because it indicates that this is a benefit that technical writers may no longer expect to find as standard if this trend continues.
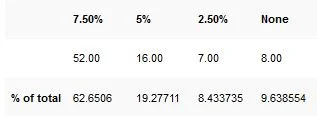
7.50%5%2.50%None
52.0016.007.008.00
% of total62.650619.277118.4337359.638554
Salary Increases (Raises and Job Changes)
This statistic is based only on those writers who reported as employees in both Q3 and Q4. It does not include writers who joined the survey this quarter, writers who moved from freelance to employees, or writers who are between jobs. There are two sets of figures, one includes those who reported no change and the other only includes those whose salary changed.
This table is a little difficult to read. The average change among all those who participated last quarter was +2.27%, this includes those who reported no change. The median was no change and the 75% increase was +1.44%.
However, of those who reported a change in salary the average raise was 5.3% and the median raise was 2.56% of the previous quarter's adjusted salary. Those in the 25 percentile of change had a decrease in adjusted salary of 2.02%. Those in the 75% of change received an increase of 7.56% over the previous quarter's adjusted salary.
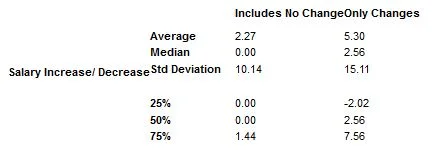
Salary Increase/ Decrease
Includes No ChangeOnly Changes
Average2.275.30
Median0.002.56
Std Deviation10.1415.11
25%0.00-2.02
50%0.002.56
75%1.447.56
Bonuses
This question was added to the survey in April. Prior to that respondants were only asked whether or not they received annual bonuses. Bonuses were only included in the adjusted salary when they the amount was known in advance and served as part of the regular pay package (for example a 13th salary). 1/12th of the minimum amount of the bonus was added to the gross salary. During Q2 and Q3, all bonuses were left out of the adjusted salary figures and respondants were asked about bonuses received during the past 3 months.
The results of this statistic may be deceptive because a number of writers reported as comments that they receive a number of small bonus during the year. Therefore it appears that this question needs to be changed in the future.
This quarter there were fewer bonuses and those given were a smaller percentage of salary. This fits well with expectations that annual bonuses are given during Q1 (reported in Q2) and Q4 (reported in Q1 of the following year).
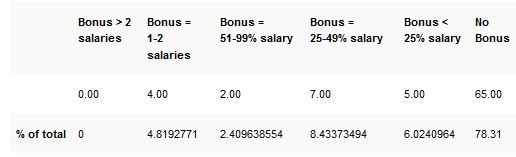
Bonus > 2 salariesBonus = 1-2 salariesBonus =
51-99% salaryBonus =
25-49% salaryBonus <
25% salaryNo Bonus
0.004.002.007.005.0065.00
% of total04.81927712.4096385548.433734946.024096478.31